6 Benefits of Data Visualization for Your Business
Big data is an inexhaustible source of value for business. Based on data insights, companies can improve their products, provide customers with more personalized services, increase performance, security, conversion rate, revenue, and basically any business metrics that have growth potential.
Visualization and analytics play a pivotal role in leveraging big data. Data itself may have little to no benefit for business. It may be presented in a large number of datasets, unsorted silos or unreadable forms. Visualization and analytics are focused on turning this data into a practical source of high-value insights.
In this article, we talk about the key benefits of data visualization and show how big data visualization can impact your business strategy and growth.
There are several definitions that explain the meaning of data visualization. All of them refer to the same idea — this is a process of turning complex into simple.
Big data visualization involves the use of methods, techniques and tools (we are going to talk about them later in this post) to translate relationships within data into visual language — charts, maps, diagrams, matrices, etc.
Check these beautiful big data visualization examples created by Tableau that show different historical events from Napoleon’s march to every upcoming solar eclipse till 2080.

Why is data visualization important? According to Bain & Company, companies that integrate data intelligence are 5 times more likely to make decisions faster than competitors and 3 times more likely to execute decisions as intended. It makes them more adaptable and resilient to change and, as a result, more successful.
Companies recognize visualization as an essential step to translate complex data into an understandable readable format. By visualizing big data, managers find necessary information faster, process large amounts of data effectively, explore and drill down data to gain a more comprehensive understanding of their assets, processes, environment, etc. As a result, these practices completely transform decision-making in organizations.
Originally, companies saw the value of big data and benefit of data visualization only for cloud business intelligence (BI) purposes. Today, however, the growing market of IoT, AI and analytics services provide a new perspective and create a ton of opportunities for various sectors. This expands the business value of data visualization for nearly any domain, including big data analytics in agriculture, healthcare, logistics, energy, and manufacturing.
Let’s explore the pros of data visualization for businesses that work with large volumes of information and learn what else makes data visualization useful cross various industries.
Get the best of your data
We will help you define your strategy, build hands-on tools to gather, process, and visualize data, and integrate these tools into your infrastructure.
BIG DATA SERVICESWhat are the benefits of data visualization for business? With the right solutions and processes in place, businesses of every type and size can now use their data assetss and benefit from data visualization. The advantages of data visualization are so diverse that any decision-maker — from a small retail store owner to the management board at a large manufacturing company — can discover ways to solve even the biggest business challenges using data insights. Here are the key data visualization benefits that show how it works.

Present and understand data better
One of the biggest business benefits of data visualization is the simplicity and usability of visual data. Human brain can process graphic information quickly and in much bigger portions than, for example, in spreadsheets or plain text.
Visualization does exactly what our brains need — creates graphic content based on data and enables easier perception and comprehension of a large amount of information. This makes information more accessible throughout an organization and useful to solve different business challenges. Moreover, data visualization helps boost collaboration between teams and even departments.
Recognize relationships and dependencies
One of the biggest benefits of big data visualization is the ability to find unobvious dependencies and correlations. Not only does the visualization of big data help in interpreting information. Placing several data sets on one map or chart, you can spot relationships and dependencies between them, identify specific conditions for certain events or results, find links, etc. Thus, you get exclusive insights that would otherwise be unavailable if not for visualizing data.
Find patterns at scale and make predictions
Combined with advanced algorithms, big data analytics visualization can help you find patterns in data and, therefore, in related events. Some of these patterns can be seen with a naked eye, for example, on a bubble plot (see below). Others can be discovered only with the use of algorithms. Analyzing these patterns, you can make predictions, identify trends and build future-proof strategies.

Provide real-time monitoring, control and immediate response
More and more companies put IoT and big data in the core of a digital transformation strategy. By connecting people, things, and spaces, companies get better visibility and transparency of operations and processes.
Increased transparency is one of the key benefits of data visualization in business intelligence. Depending on the data source and business goals, you can use visualization technologies to monitor system performance in real time, analyze user journeys, and track assets and resources. Then use these insights to identify and immediately address issues such as system overloads, gaps in customer experience, or wasted resources.
Detect errors and measure risks
It’s hard to underestimate data visualization importance when we speak about safety and security. Visualizing data in real time can help you identify threats, find mistakes, measure and analyze risks.
For example, monitoring the performance of connected heavy machinery allows you to detect errors before they lead to malfunction or breakdown. In terms of people’s safety, visual analytics helps prevent accidents at the workplace. In high-risk industries, such as mining or construction, operational monitoring and data visualization may help save lives.
Create better products and services
If you work in a highly competitive market such as retail or entertainment, you can use your data to develop better products and provide better services. The biggest benefit that data visualization offers in this space is the ability to quickly get insights on product or service usage, analyze customer feedback, and quickly respond to emerging problems. So you can build a data-driven product or service strategies.
In this case, data visualization advantages translate into tangible returns. Because the faster you can get market insights, the faster you can manage and adjust to changing customer needs. This business agility gives you an upper hand and helps you compete.
Learn more
How user-centered design can help you create a better product
This is just a partial list of big data visualization advantages. In reality, any business focused on making sense of big data and gaining insight can discover the unique advantages of data visualization.
Modern data visualization tools help make data analytics and visualization practices an integral part of business processes and decision-making. These tools leverage cloud and databases for sorting, organizing and storing data and create graphic representation to display complex data in easy-to-read formats (on dashboards, reports, etc.).
Data visualization tools offer different services and features. Some tools automatically choose techniques (interactive charts, plots, maps, etc.) for optimal data presentation. Others add powerful big data analytics for business: sort and analyze data, determine correlations, generate and show ready-to-use insights.
What unites most data visualization solutions is rich configuration abilities which provide users with a wide range of opportunities for data manipulation, analytics and interpretation.
What are the advantages of data visualization for my business? We can help you answer this question. Let’s talk!
Big data visualization techniques and tools are diverse and keep on developing. In short, techniques are ways of representing data using visual elements, such as charts, plots, maps, infographics, etc.
Big data visualization tools are cloud-based services or custom software able to connect to the data source, extract raw data, process it and, using the right visualization techniques, display insights on configurable dashboards and reports.
Some of the most popular and recognizable examples of visualization tools are Tableau, Power BI or Elastic Stack’s Kibana for more advanced work with data. The majority of these tools provide analytics services, including machine learning capabilities. Others focus on high-end presentation of information based on VR/AR (e.g., Virtualitics).

Recently, we’ve made a detailed review of modern data visualization techniques. Check it out to learn about the types and benefits of data visualization tools for different business goals. We have divided them into groups depending on user skills and the purpose of data analytics and visualization.
We know about the importance of data visualization and the benefits of visual analytics first-hand. At Digiteum, we have been working on various data projects and helping our clients use data to solve real business problems, tackle the challenges of big data, build effective strategies, and create great products. Here are a few excellent examples of big data visualization that demonstrate the benefits and returns from data investment.
Increase conversions and improve services
One of our clients runs a feed.fm platform for augmenting user experiences with audio content. It is widely used in services like Fitbit and MIRROR. We integrated advanced data analytics and visualization tools based on ELK stack into the platform to provide the client and users of the platform with high-value insights on streaming performance, conversions, and events.
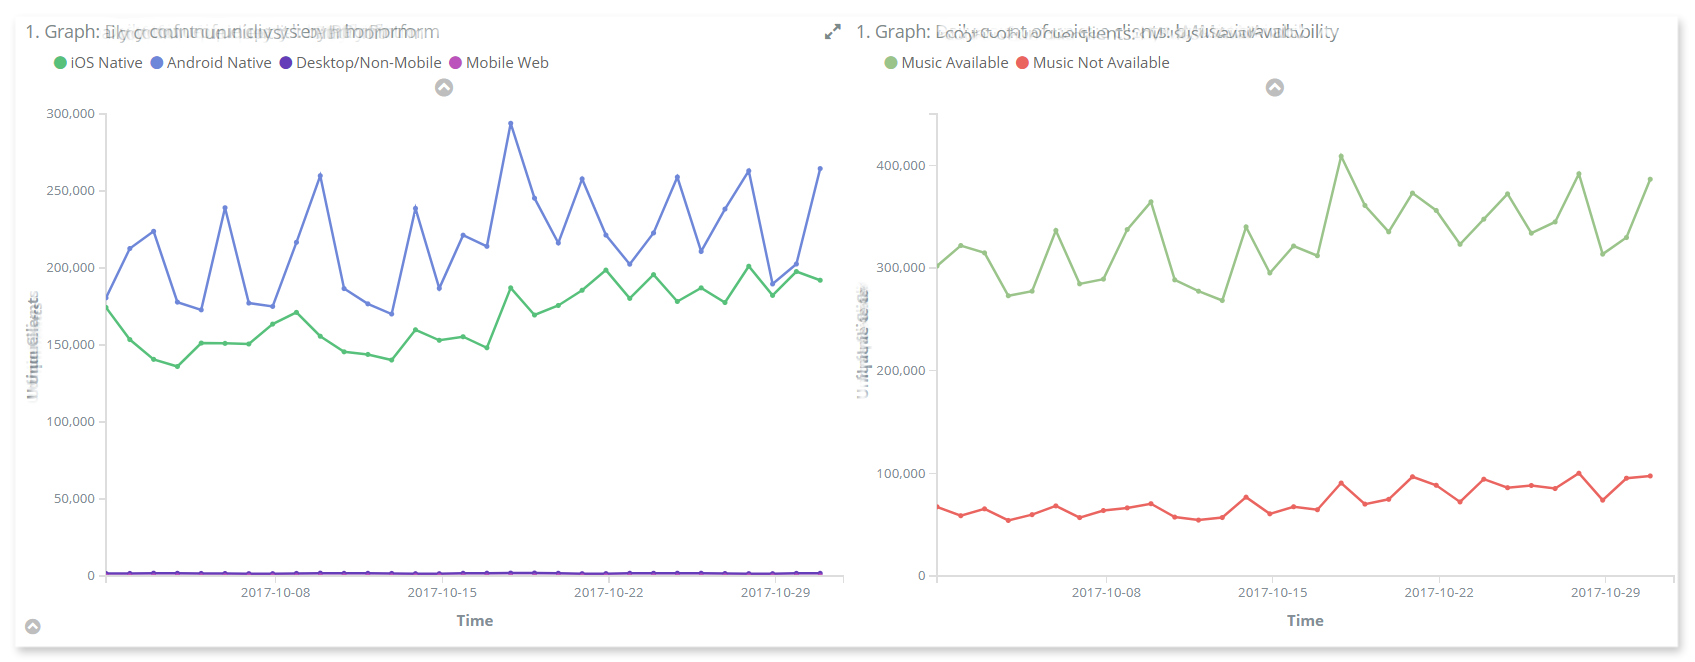
Today, the client leverages the benefits of visual analytics to identify where the system falls short and identify the events leading to the highest conversion rate. As a result, decision-makers on both ends now use visual information and insights to improve customer engagement, increase conversions and optimize both the platform and applications connected to it. Read the full success story…
Enhance performance and enable scalability
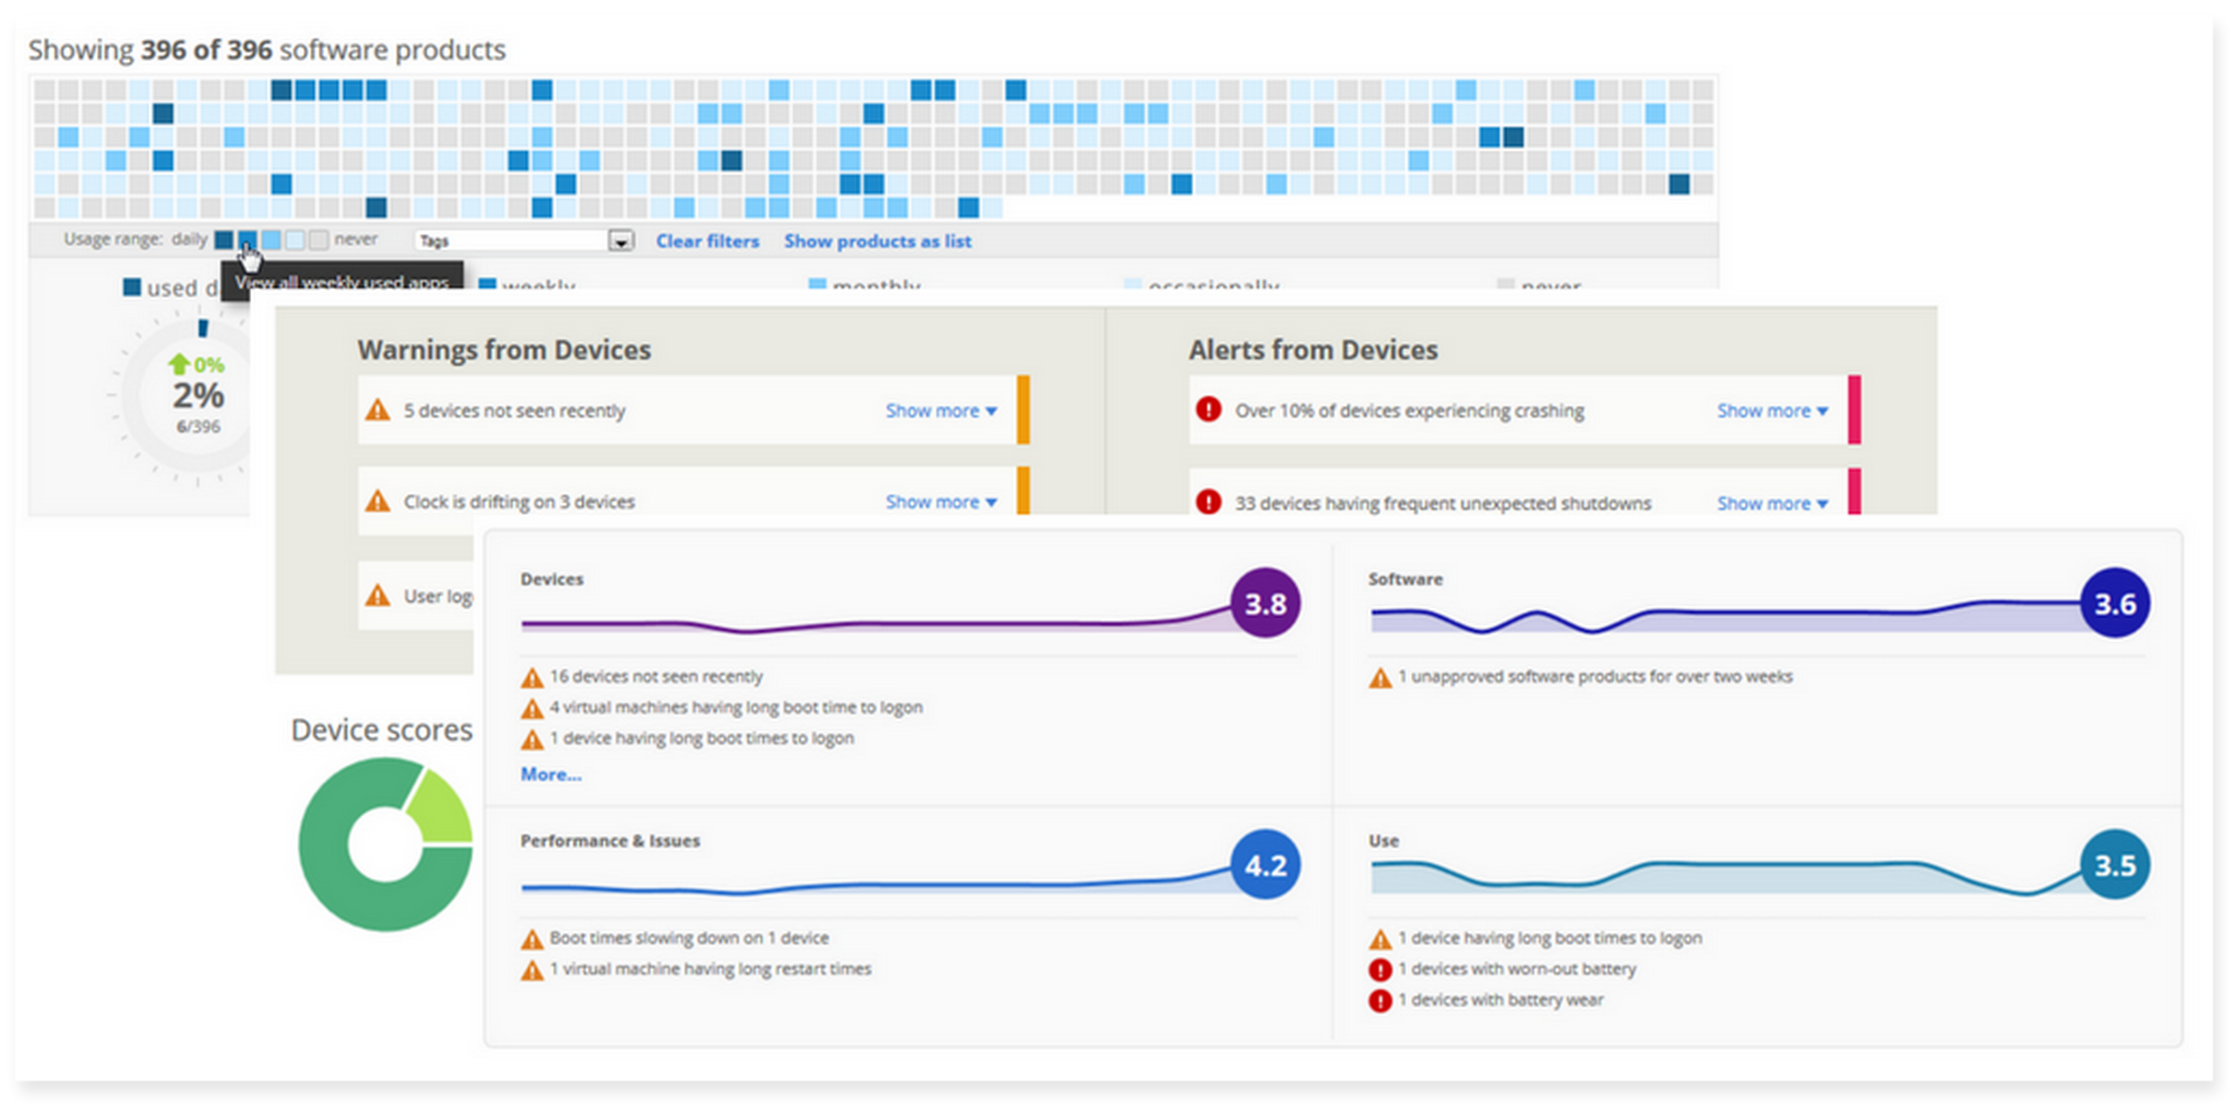
Our long-standing client, a leading photo printing provider in the US Printique, experiences an increased influx of customers on their web system every year during holiday season. The lab’s online services have to withstand extreme traffic growth by up to 300%. If not addressed properly, this increase in load may cause slowdown, crashes and, as a result, lost sales and declined customer satisfaction.
Our dedicated .NET team designed and developed a custom monitoring and control tool based on the combination of Elastic Stack solutions. The goal was to combine powerful analytics and the benefit of effective data visualization. Using this system, management, production and support teams see the whole infrastructure in real-time on their dashboards, receive alerts, and maintain consistent and stable performance across all processes both online and on the production site. Read the full success story…

Looking for an experienced technology partner to provide .NET application development services? Let’s talk!
Turn terabytes of data into a language platform
Language corpus platform for Oxford University Press is perhaps one of the most unique big data projects we have worked with. The platform was designed to process massive volume of lexical data at an incredible speed. Just to give you an idea — it can process all news articles in English produced throughout the entire Internet daily within only 3 hours.
We know that data visualization can help monitor and manage processes in real time. So in order to cope with this volume of data and keep it stable, we configured an Azure-based platform to visualize the data pipeline in real time. As a result, the visibility of the workflow helps the keep uninterrupted productivity — the system can take up to 10x overloads and still successfully process from 800k to 8 million raw documents per day. Read the full success story…

Discover unique data visualization benefit for your business
We will help you develop an effective strategy for your company and receive tangible returns from your data investment.
CONTACT DIGITEUMQuick wrap-up
Data visualization helps businesses unlock the value of big data and get quick access to critical insights. It enables faster decision-making, improves understanding, and enhances overall performance within the organization. Companies integrating data intelligence are more likely to succeed, adapt to change, and outperform competitors. Visualization is no longer limited to BI; it benefits diverse sectors, making it essential for businesses across industries.
This post was originally published on December 9, 2021 and updated on May 12, 2023.
FAQ
- quickly respond to customer feedback to build better products and provide better services;
- enable real-time monitoring, control and can immediately respond to problems;
- detect errors, foresee and measure risks;
- better present and understand data;
- recognize relationships and dependencies in data;
- find patterns and make predictions.